Home / Replicate / The Mesa Ranch observation desk: journalism as intelligence, in a vault
A vault
The Mesa Ranch observation desk: journalism as intelligence, in a vault
The method in the slides, working, on synthetic records, in a vault you can open.
One desk, three ways in
The idea, the tour, and the vault itself: read them in order, or open the vault straight away.
1 · The ideaWhen journalism becomes intelligence, builtFrancesco Marconi's argument and slides, and why we built them as an observation desk in a vault.
2 · The tourInside the Mesa Ranch deskEvery page of the vault in turn: what it shows, what to click, and what it proves.
you are here
3 · The vaultThe Mesa Ranch observation deskSeventeen pages and five graphs, on synthetic records, in an sgit vault you can open and clone.Open the vault ↗The vault page
Everything in this vault is synthetic. The campus, the county, the companies, the agencies' names and all sixteen records are invented. The vault is modelled on the data-center example in Francesco Marconi's INMA talk, When journalism becomes intelligence, and describes no real organisation. The real project the slides drew on is described in public reporting linked from the article; the tour walks through every page.
Open it yourself. The key is the whole credential.
Read key:
In the official UI: open it read-only in a new tab · From the CLI:
Published deliberately under the
Read key:
sgit_public_read_4f77e3b19832f0435da5310eb2ae925defd9e59d51bc41b6510ce494493b3818:hn1s3h6qIn the official UI: open it read-only in a new tab · From the CLI:
sgit clone sgit_public_read_4f77e3b19832f0435da5310eb2ae925defd9e59d51bc41b6510ce494493b3818:hn1s3h6qPublished deliberately under the
sgit_public_read_ prefix, and derived one-way from a vault key that is not in this repository. Read back with this key before it was published: 63 files, the same pages.Open the vault, full screen → or see it here, below
Opens in the vault's own app, read-only, with the published key: seventeen pages, a menu on the left, details on the right.
See it live, here
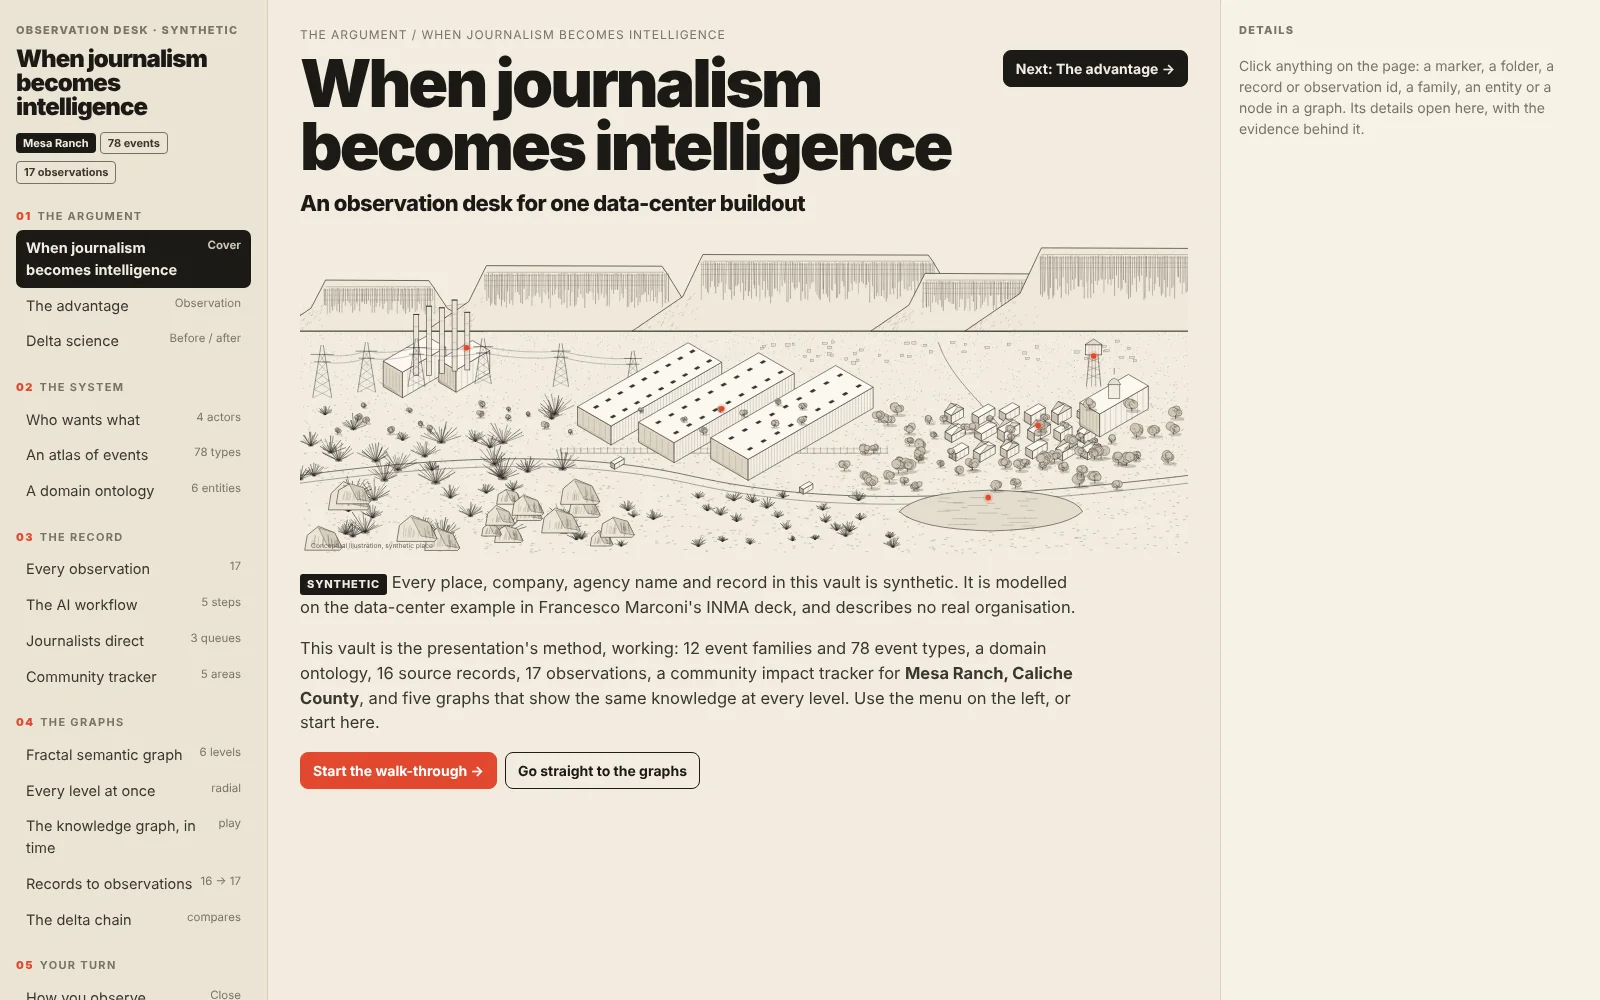
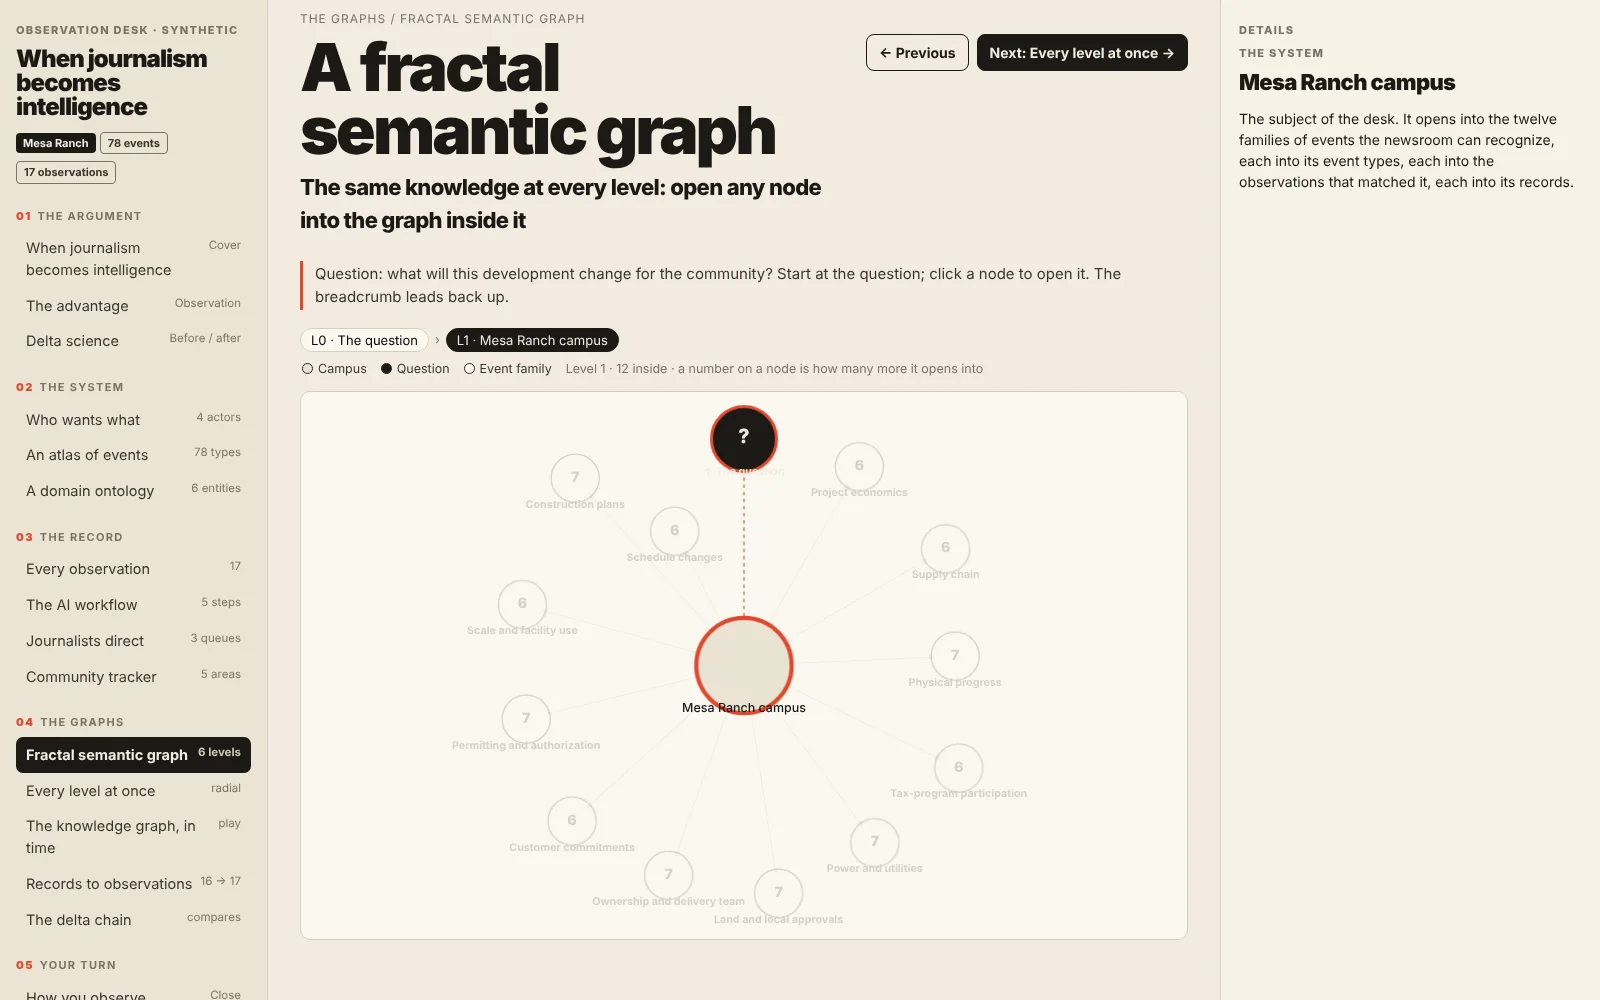
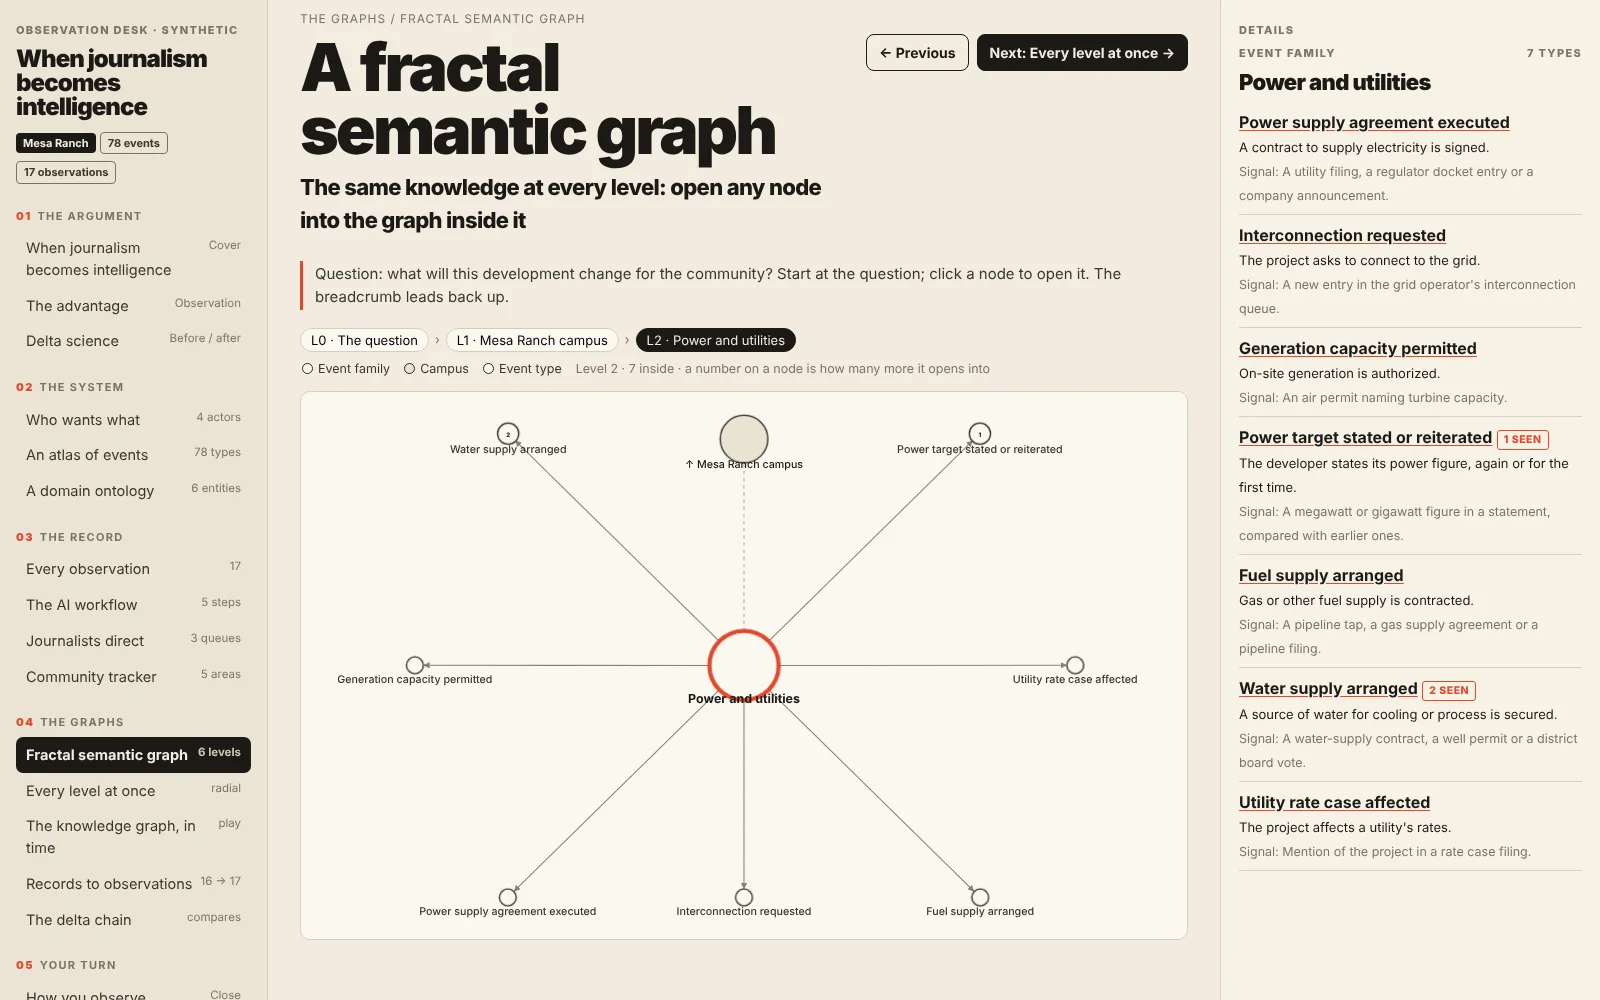
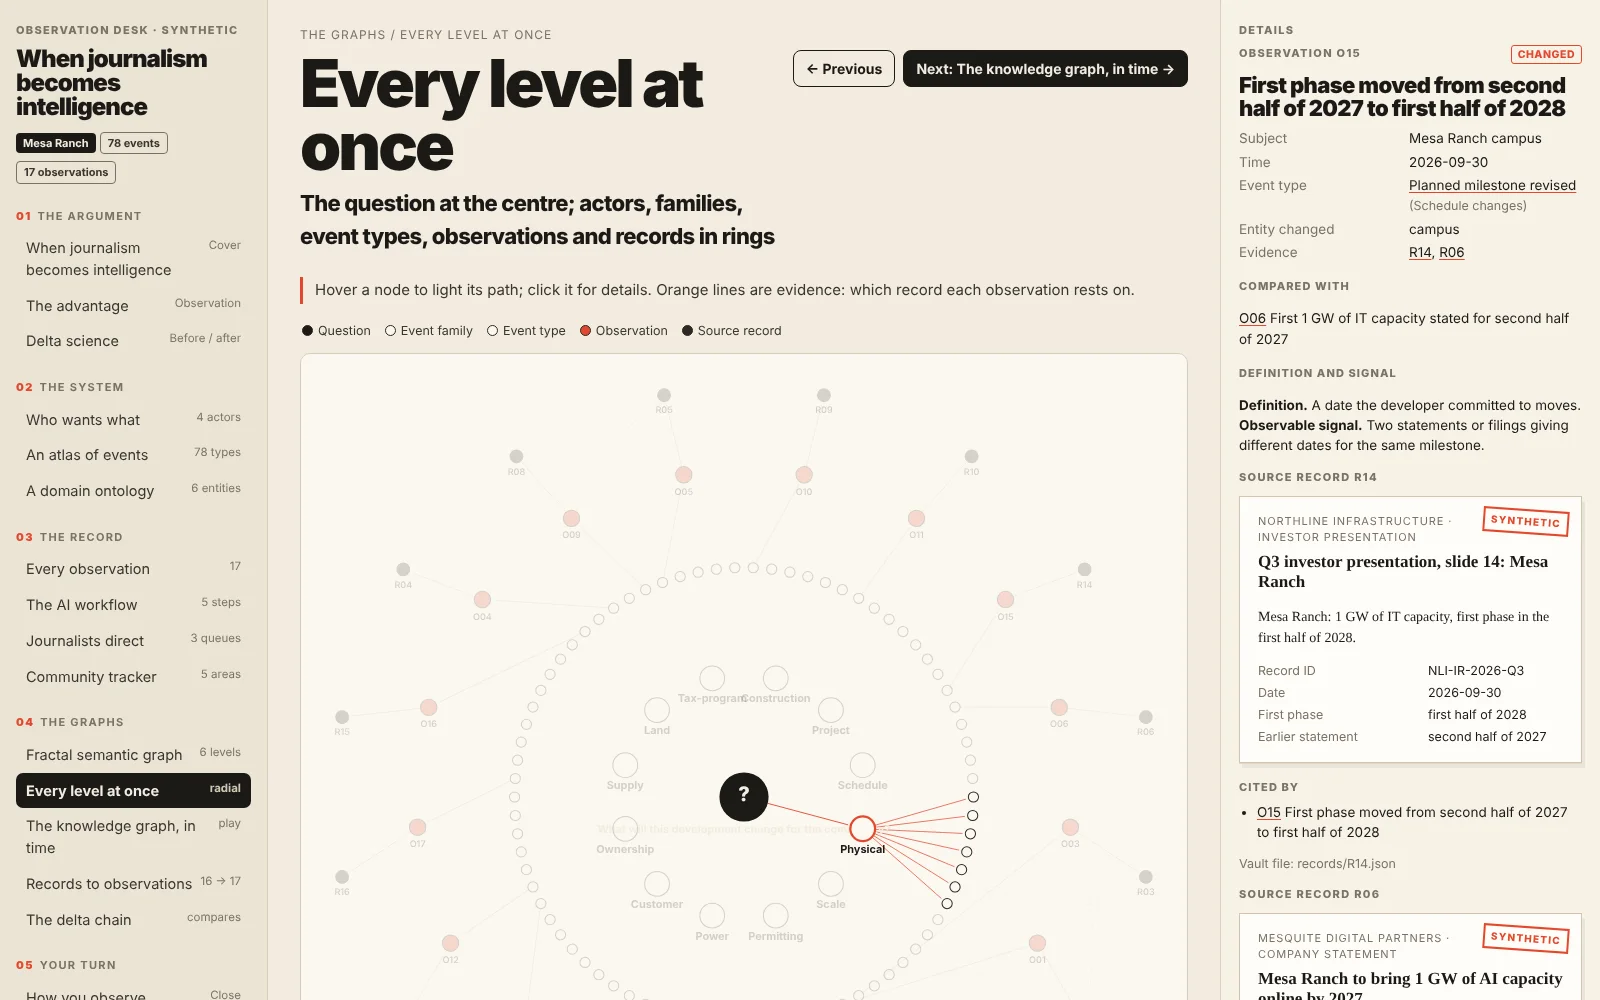
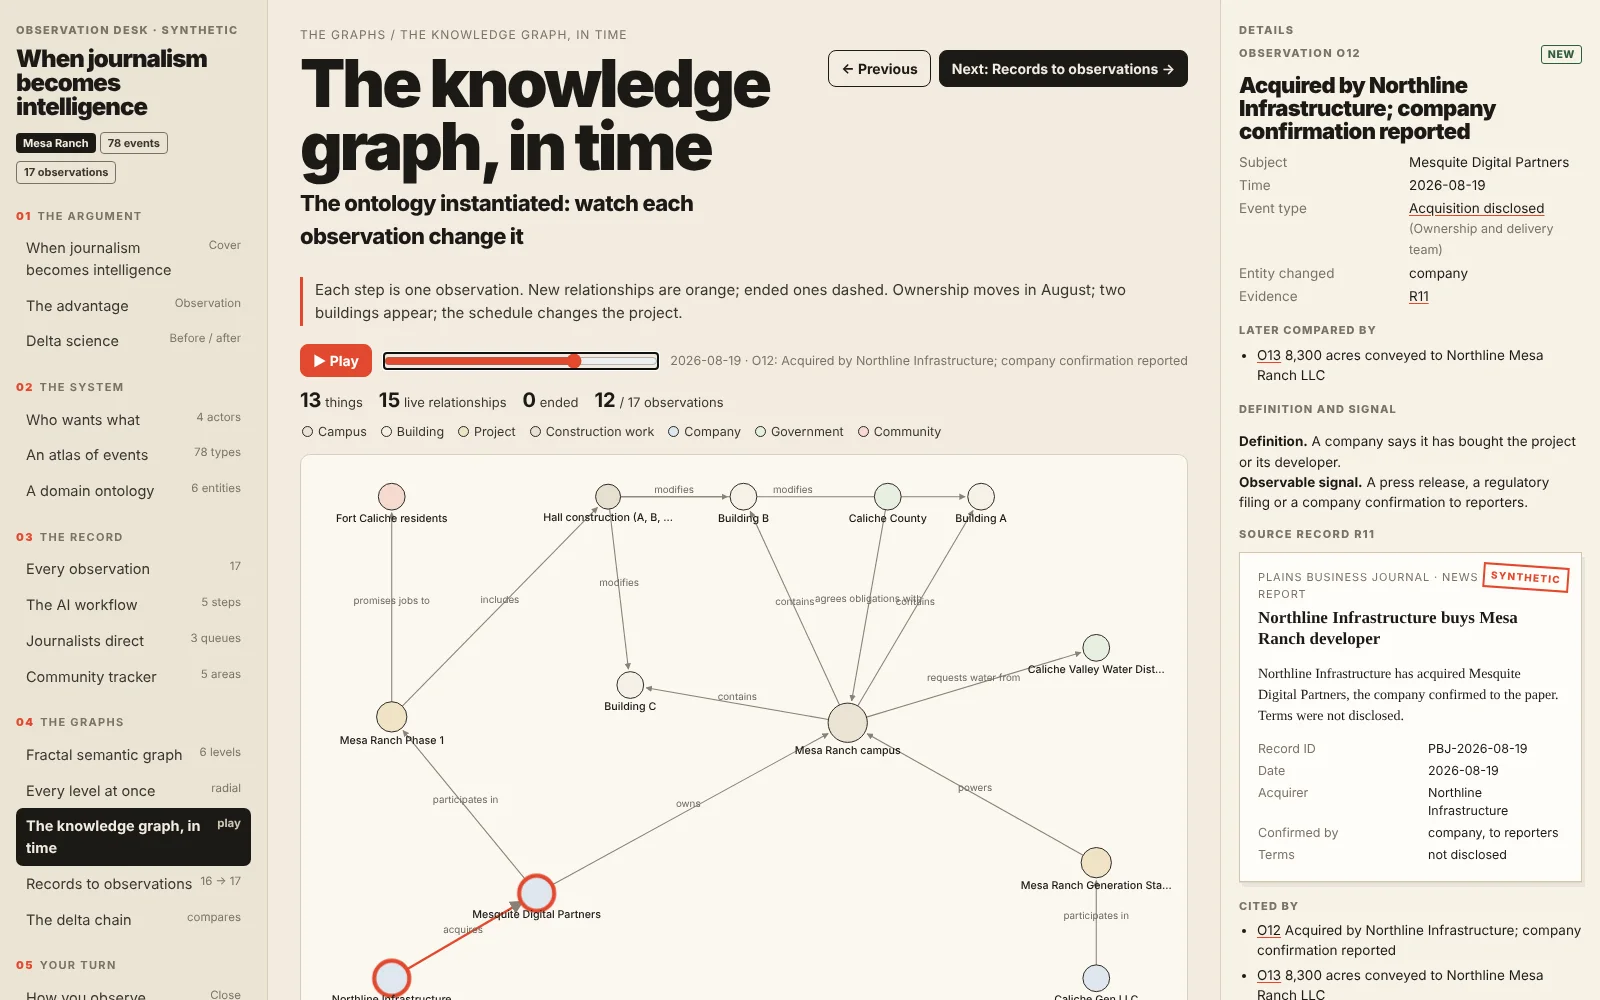
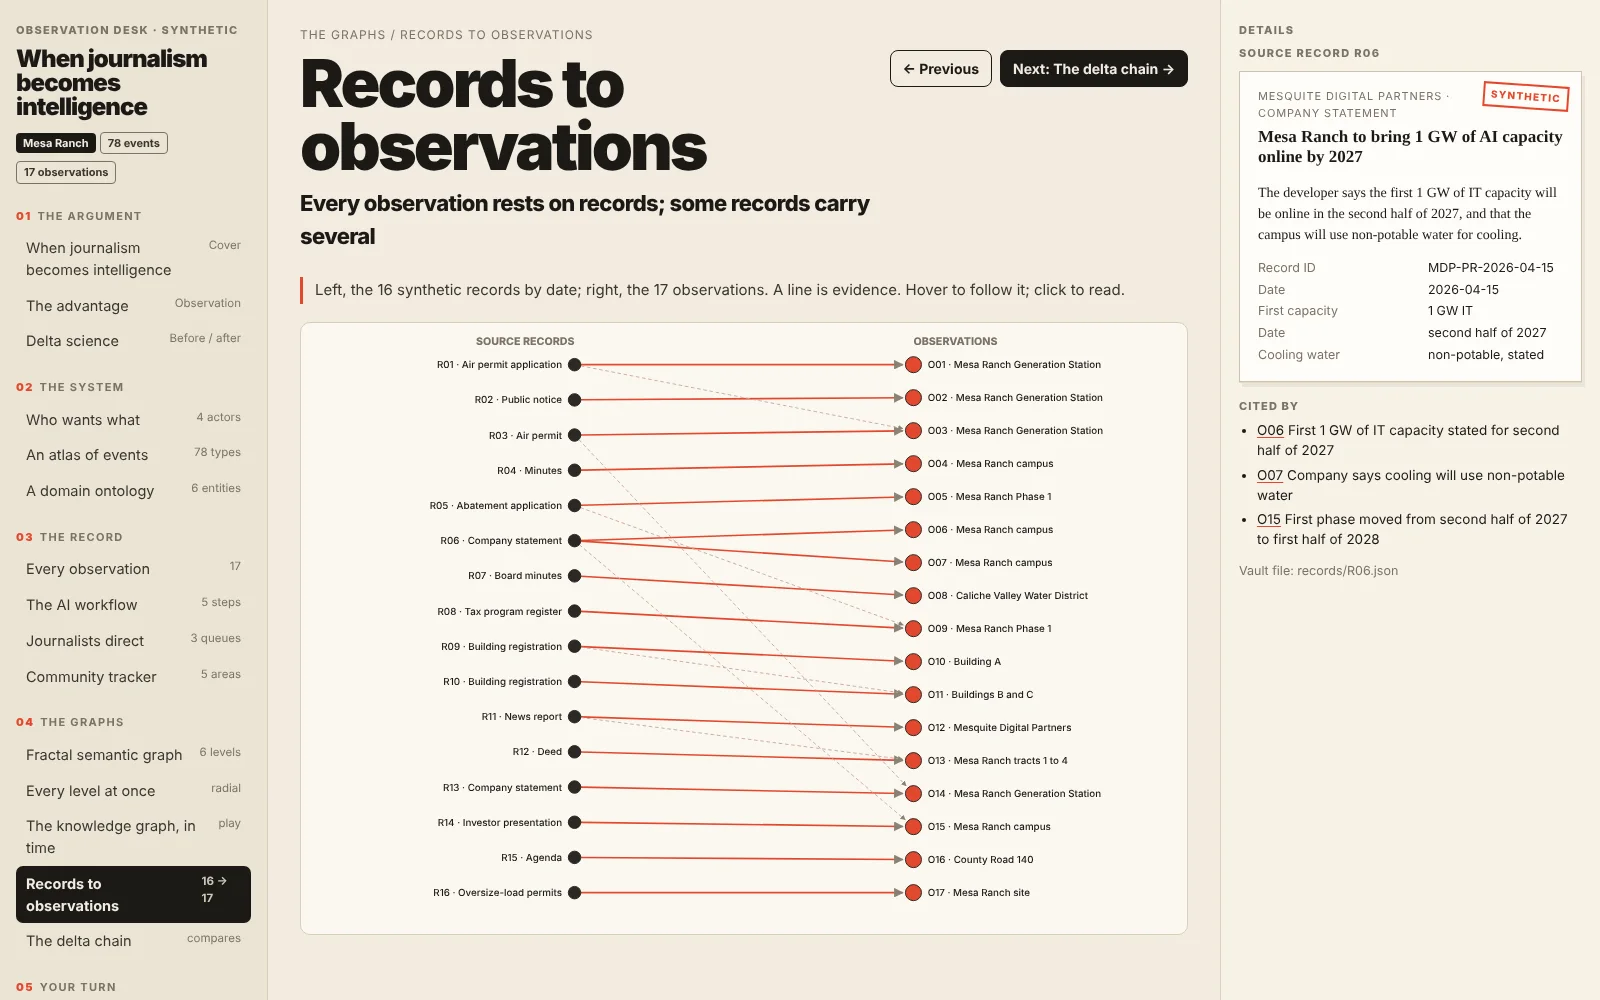
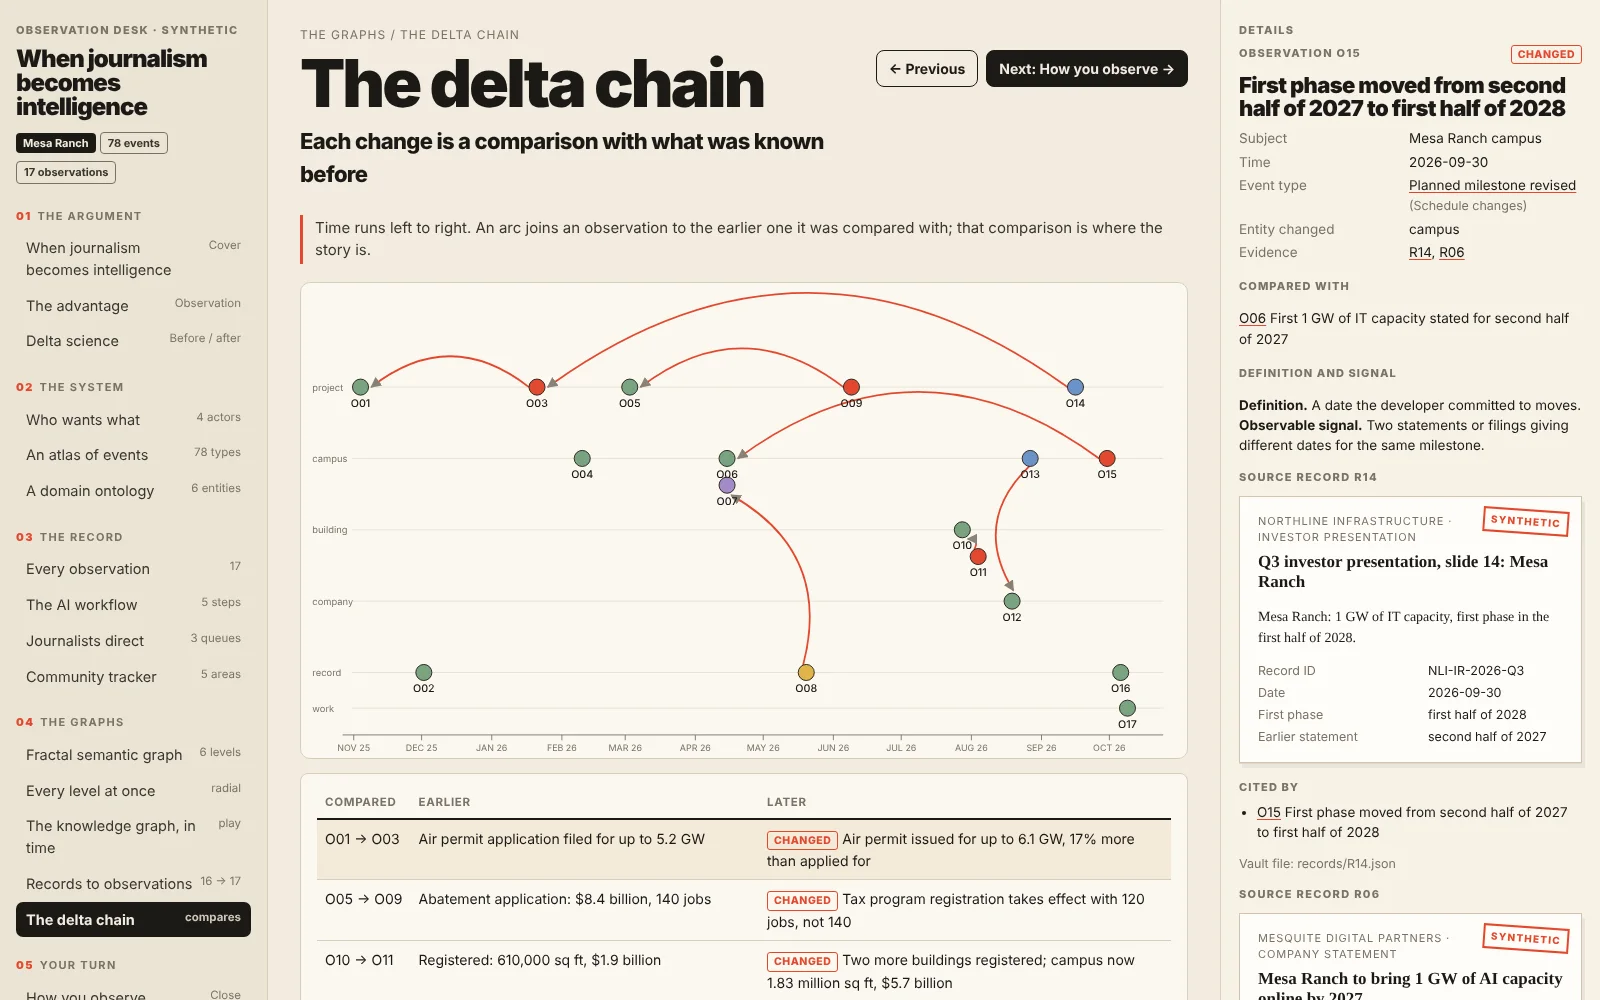
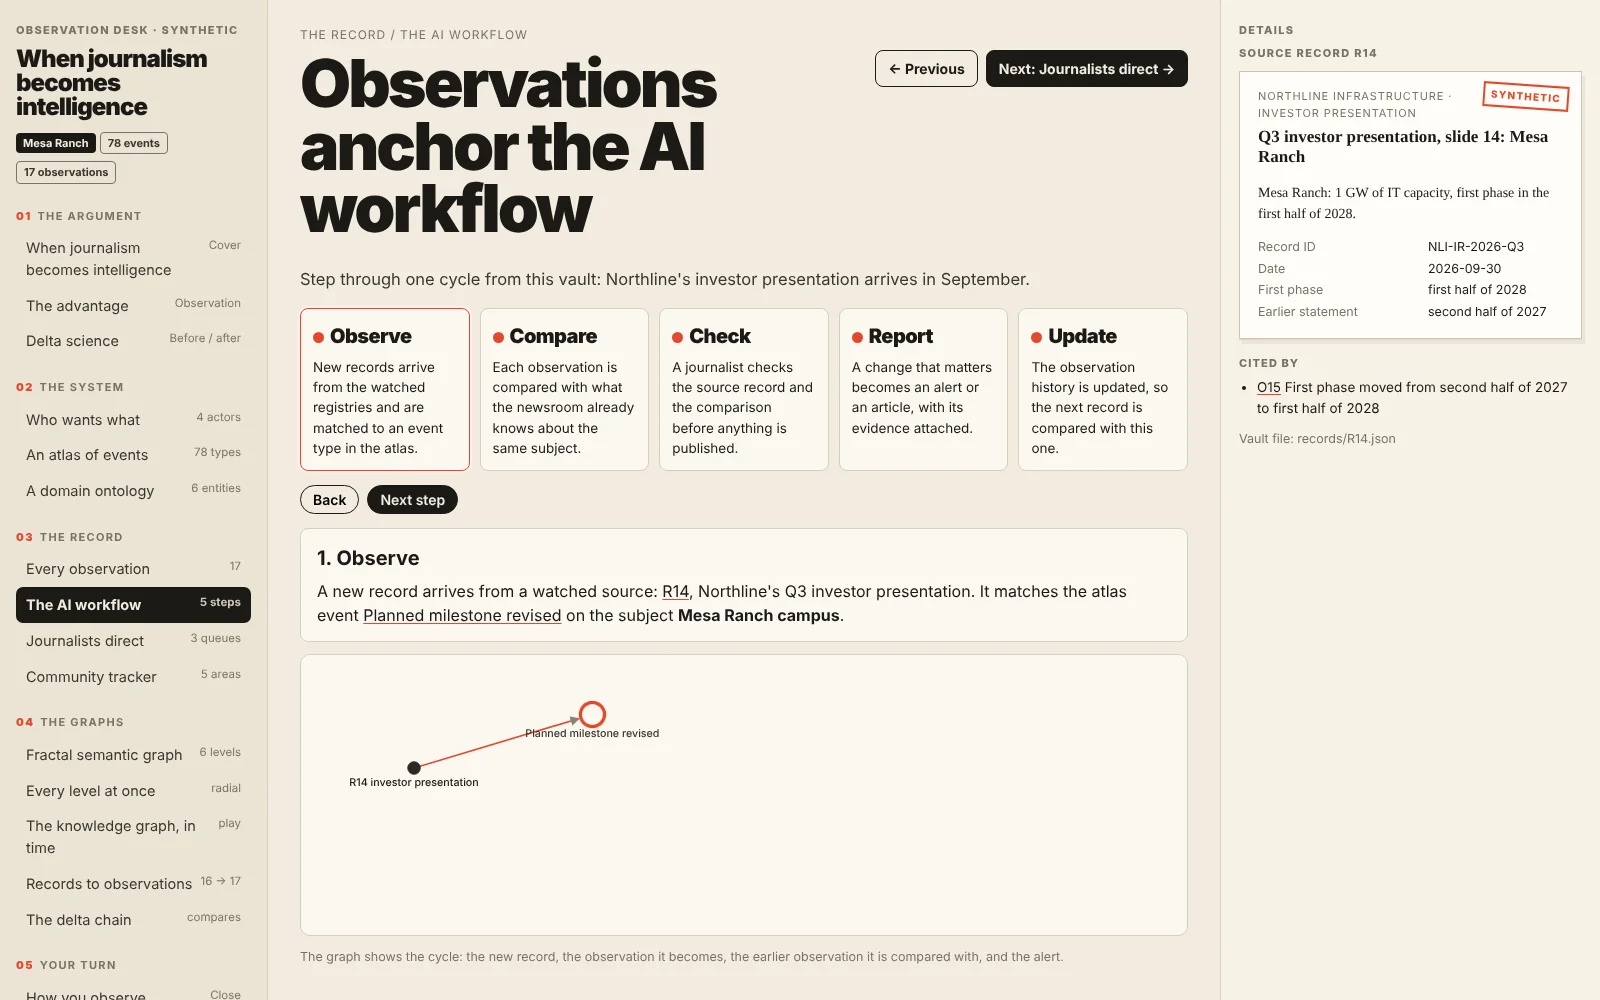
The vault opens as an app of seventeen pages: the eleven slides, each working on the vault's own data, and five graph pages. Every marker, folder, record, observation and node opens its details on the right.
What is in it
| Path | What |
|---|---|
index.html and 16 more pages | The desk, one page per menu item; inlined CSS and JS; every illustration and graph drawn as SVG in the browser, in the deck's pen-and-ink style; the data inlined as a fallback. |
instances.json, compares.json | The knowledge graph, each relationship with the observation that made it, and the delta chain. |
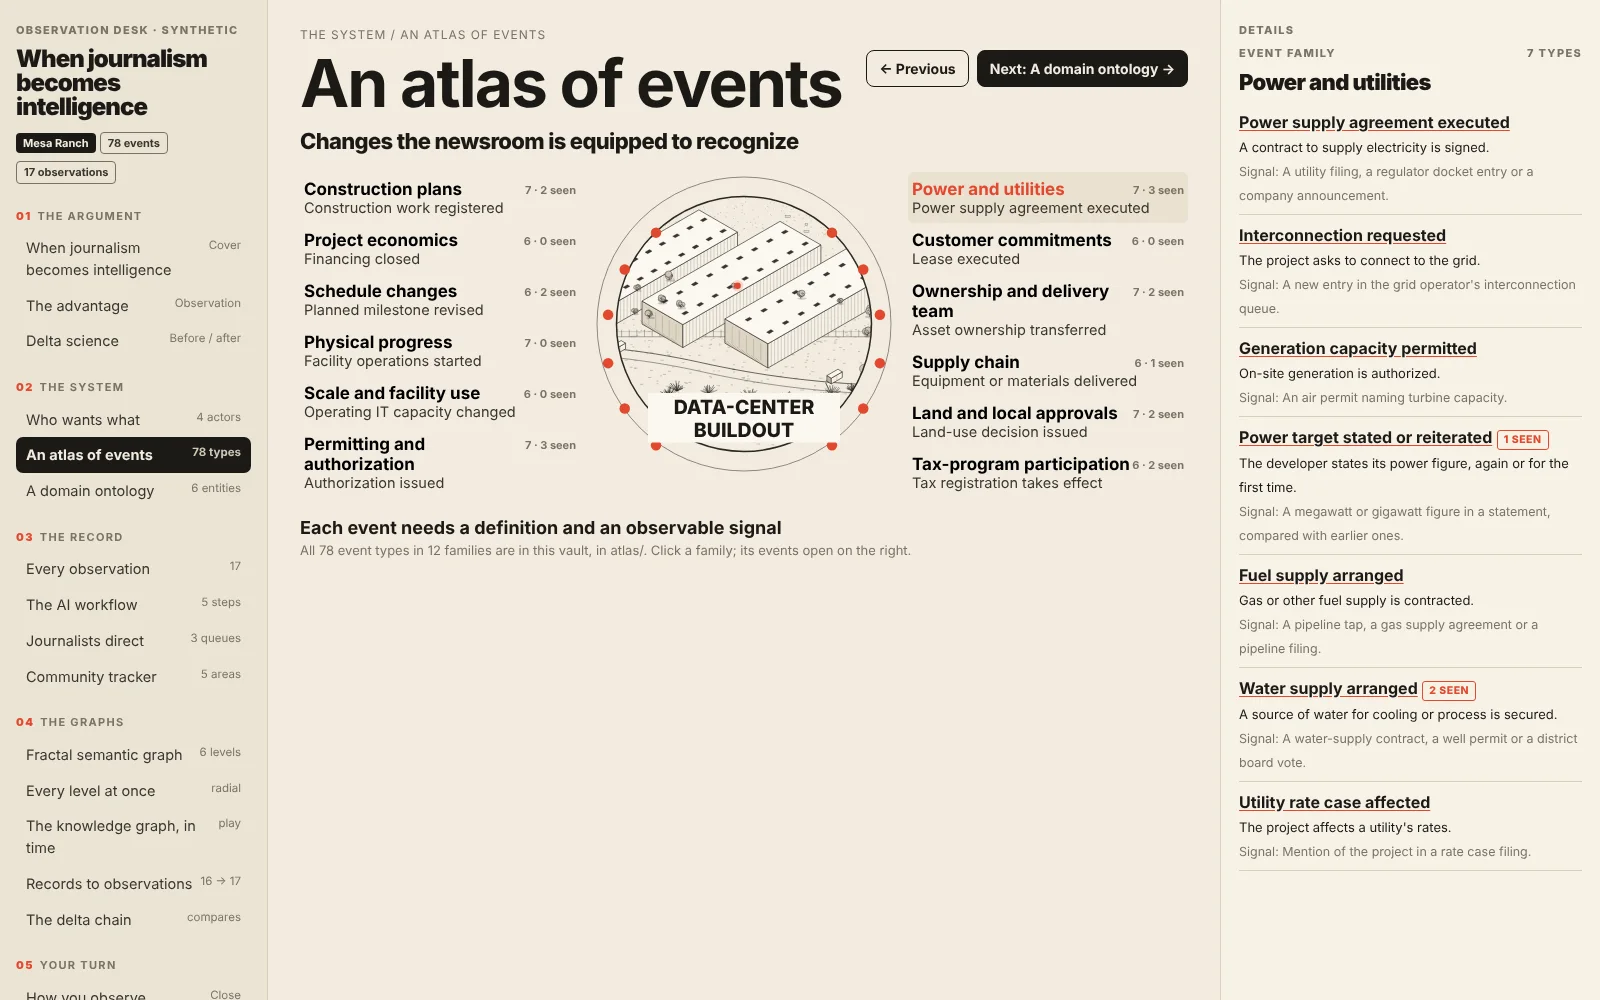
atlas/ | 12 event families and 78 event types, each with a definition and an observable signal. |
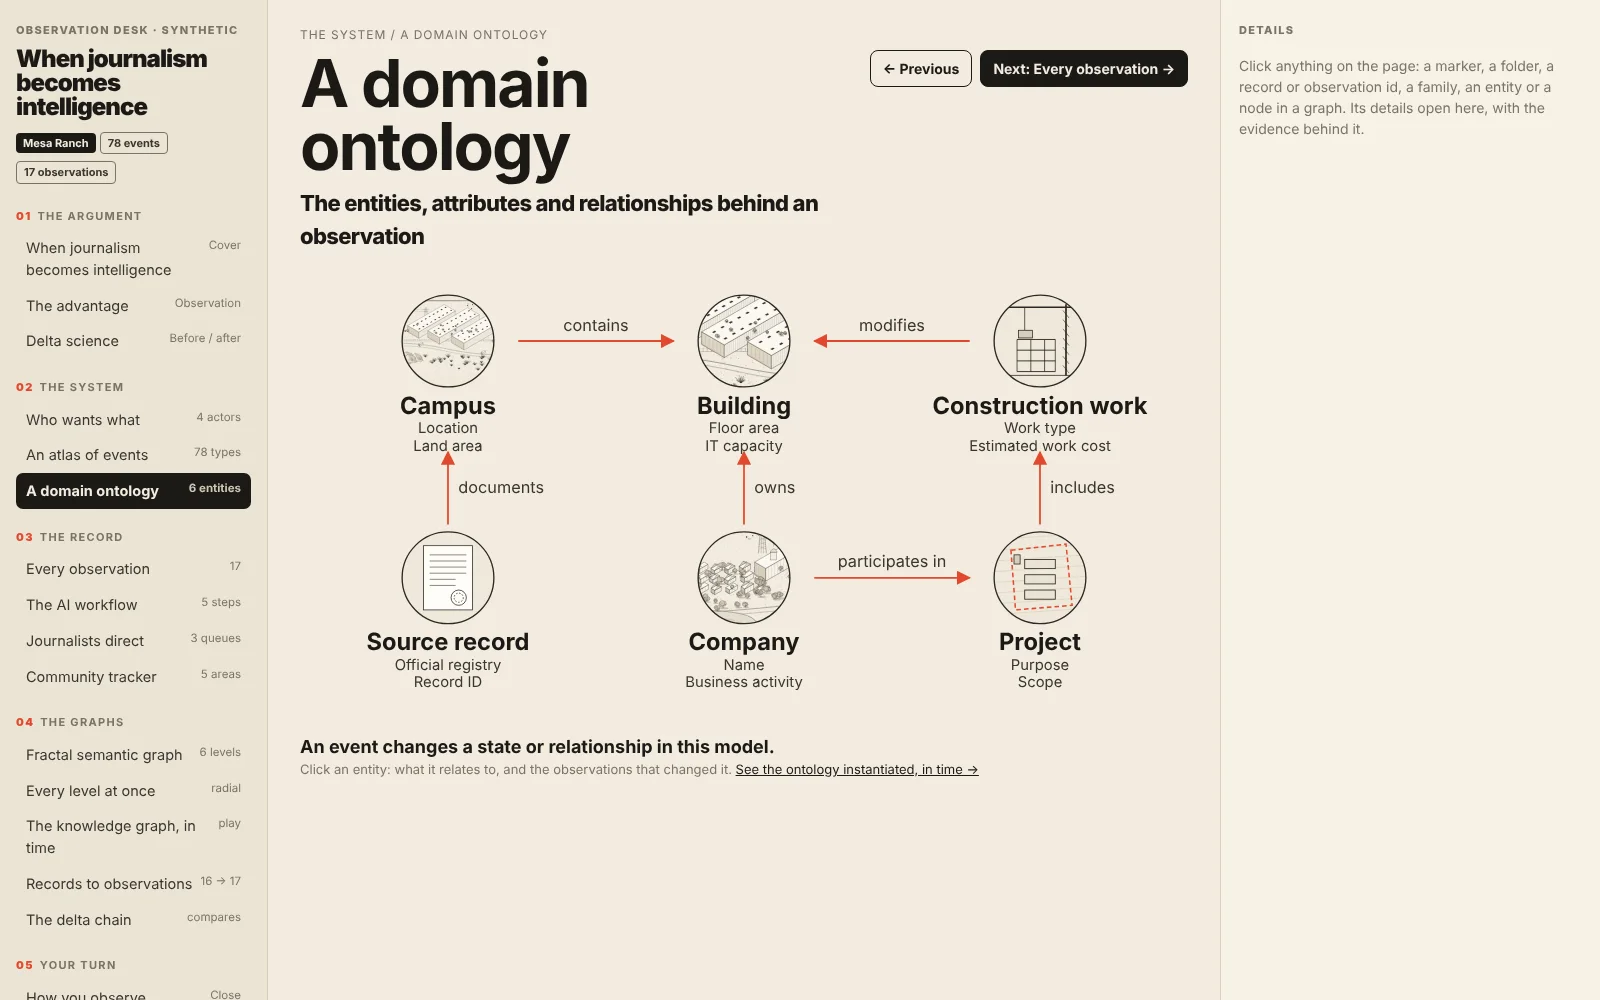
ontology.json | Six entities, their attributes and six relationships. An event changes a state or relationship in this model. |
records/ | 16 synthetic source records: an air permit and its application, a public notice, minutes, an abatement application, statements, building registrations, a deed, an investor presentation, oversize-load permits. |
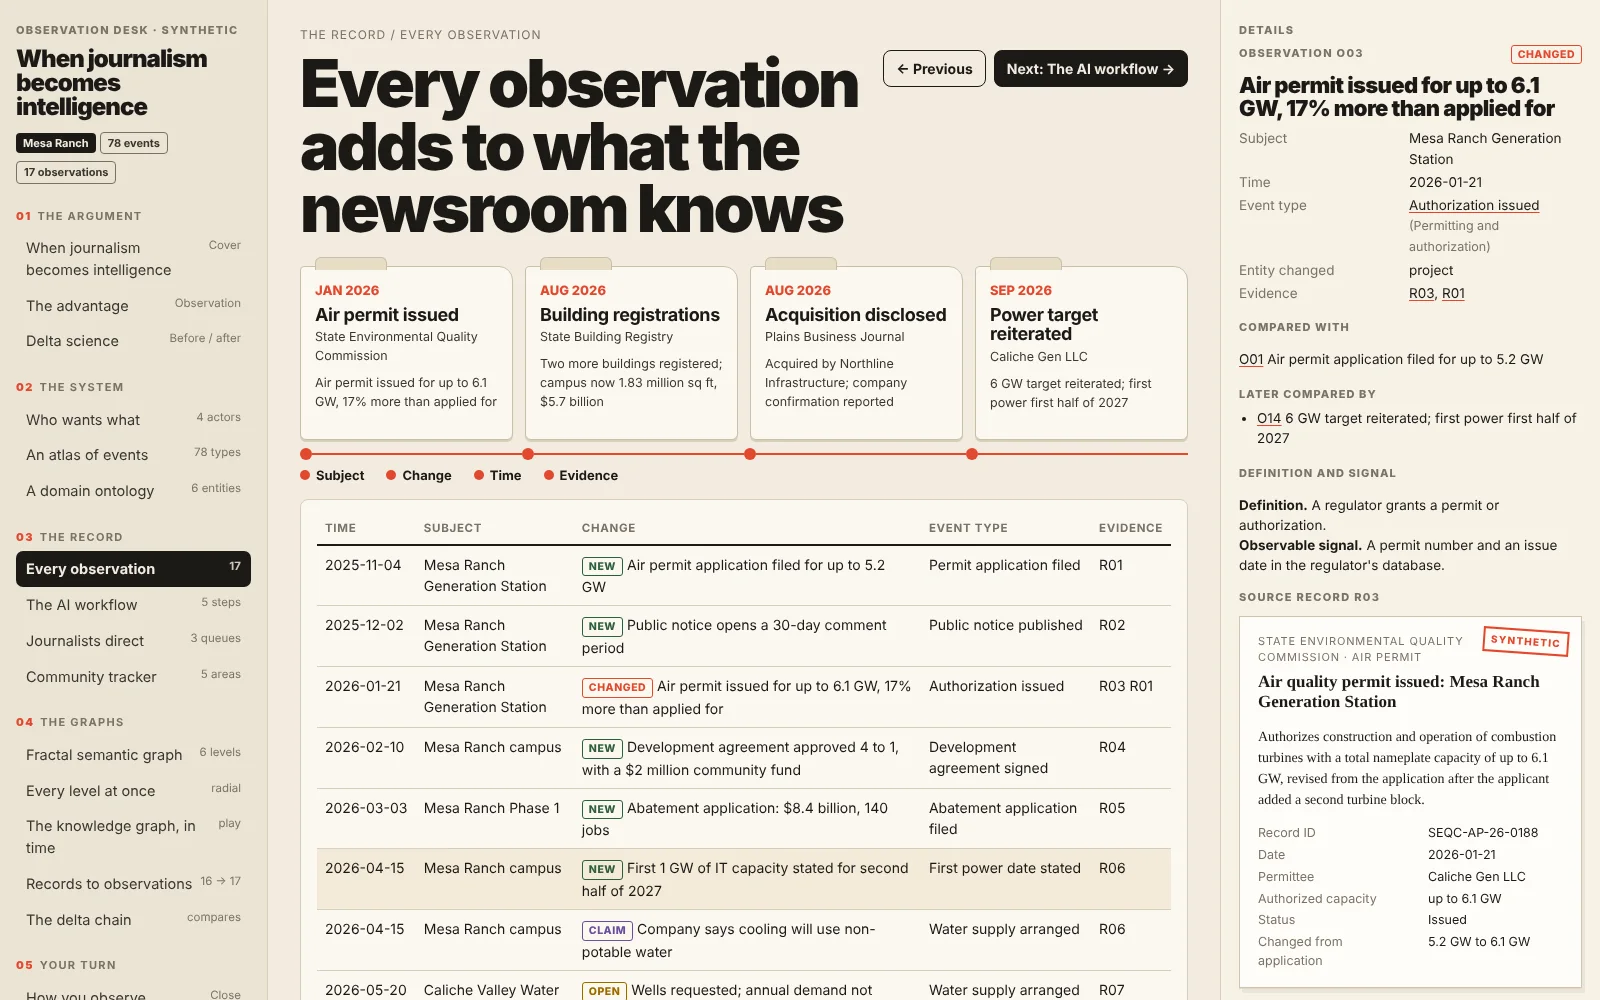
observations.json | 17 observations, each a subject, a change, a time and its evidence, matched to an event type. |
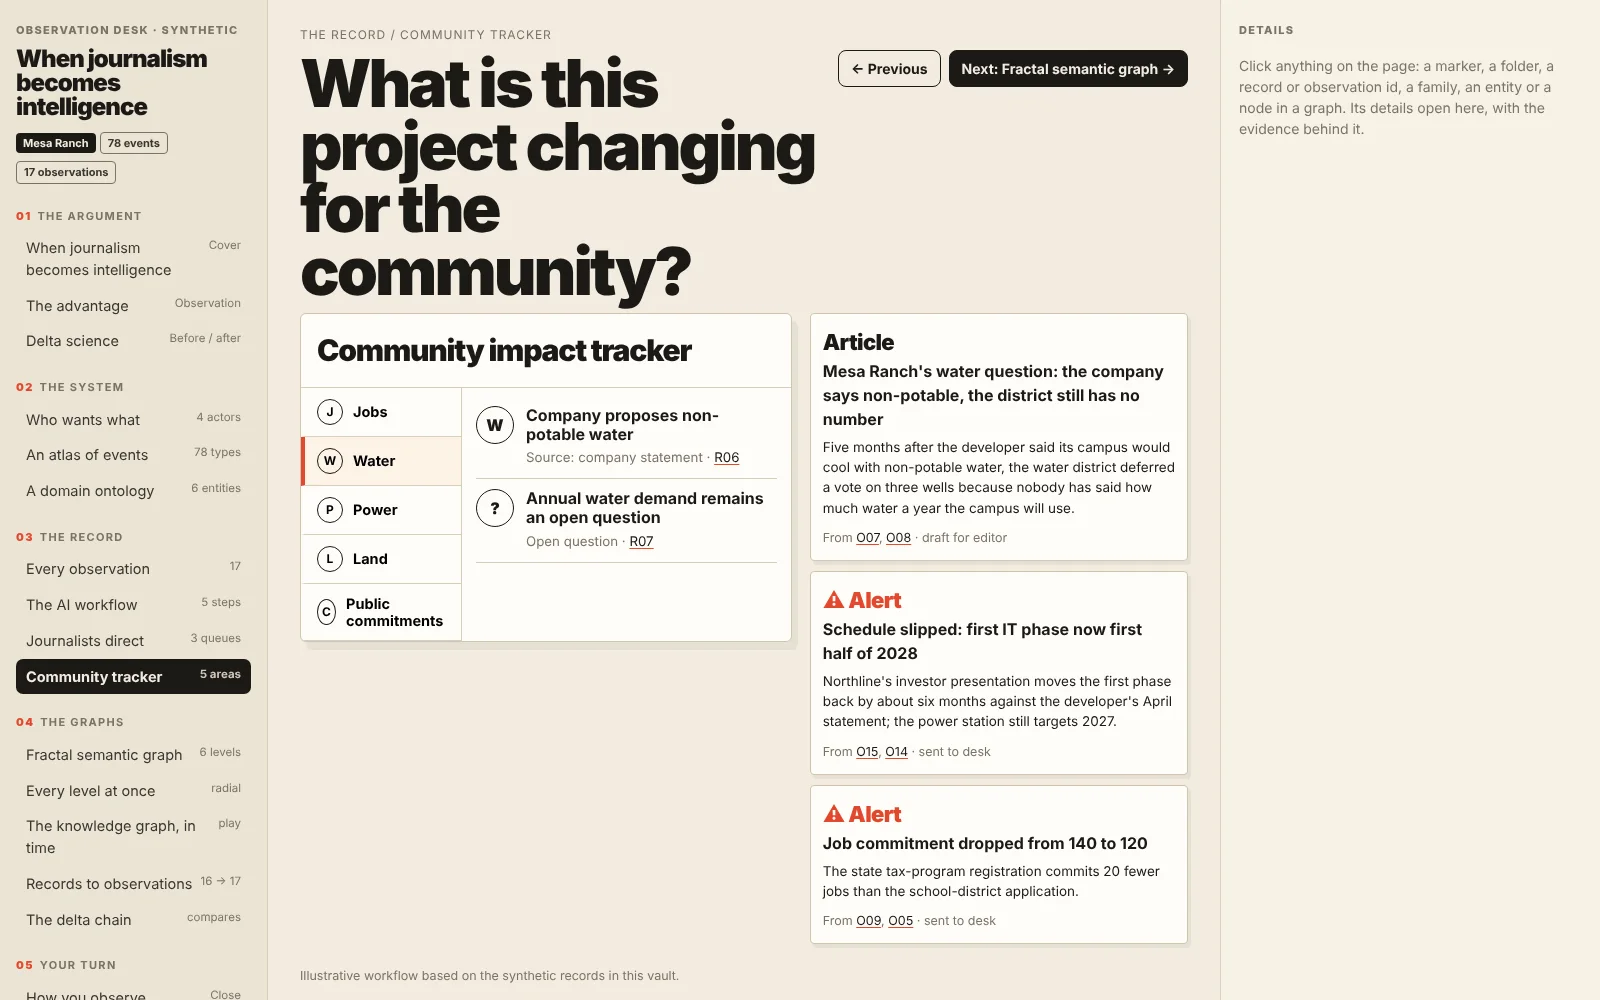
tracker.json, outputs.json | The community impact tracker and the article and alerts it produced. |
tools/ | The scripts that build all of it. Replace the families, entities and records with your own beat; the app does not change. |
A tour